Why this matters
A rolling forecast is the file on a controller’s desk during the close. It has to do three things at once: produce a defensible base case, surface what would change the base case, and stay re-runnable when next quarter’s data arrives. The work is mostly discipline: sourcing, assumption hygiene, and scenario clarity, not modelling.
This project is built around Belimo Holding AG (SIX: BEAN), a Swiss listed industrial. The reporting is clean enough to support a public portfolio build without proprietary data: regional net sales, group EBIT, capex, working capital, and management commentary on the demand drivers. That keeps every figure on the page traceable to a public source.
How the model is built
Driver-based, not regression-driven. Three regional revenue drivers feed into a single P&L, FX-translated to CHF; a working-capital and capex layer produces operating cash flow and free cash flow; scenarios flex the inputs and a sensitivity tornado surfaces which assumptions actually move the result.
EMEA driver
Constant-currency baseline anchored on FY2019 to FY2025 normal-year mean: 7.16%.
Eurostat EU27 construction production used as the macro signal. OLS sanity check: n = 6, slope 1.08, R² 0.54.
Documented elasticity held conservative at 0.8.
Americas driver
Baseline constant-currency growth: 16%.
FRED A33HNO used as the macro signal. OLS sanity check: n = 7, slope 2.44, R² 0.57.
Documented elasticity capped at 1.5, so the signal is used without over-claiming.
APAC driver
Trend baseline: 13% constant-currency growth plus scenario tilt.
No regression. Public reporting does not disclose country mix, so a single macro proxy would over-claim.
Currency framing is explicit: the model forecasts in constant-currency growth rates (which Belimo publishes per region) and translates to CHF via SNB FX assumptions. EMEA via EUR/CHF, Americas via USD/CHF, APAC via USD/CHF as a proxy with the limitation flagged in the assumption log.
What the discipline looks like
Twenty-six assumptions live in a single assumptions.yml file, each with a name, base/upside/downside values, source, date sourced, and rationale. Both the human-readable assumptions.md and the Excel Assumption_Log sheet are generated from that YAML. There is no second source of truth, and no path for the rendered files to drift out of sync with the model.
Provisional rows stay flagged. Examples: APAC FX uses USD/CHF as a proxy because country mix is not disclosed; the case study and the Excel sheet both show the flag, not just the YAML. The intent is that anyone reading the workbook spots the soft places before being told.
A sensitivity tornado holds every assumption at base, then flexes one at a time and measures the change in FY2026 EBIT. The result is the FP&A finding worth keeping in mind:
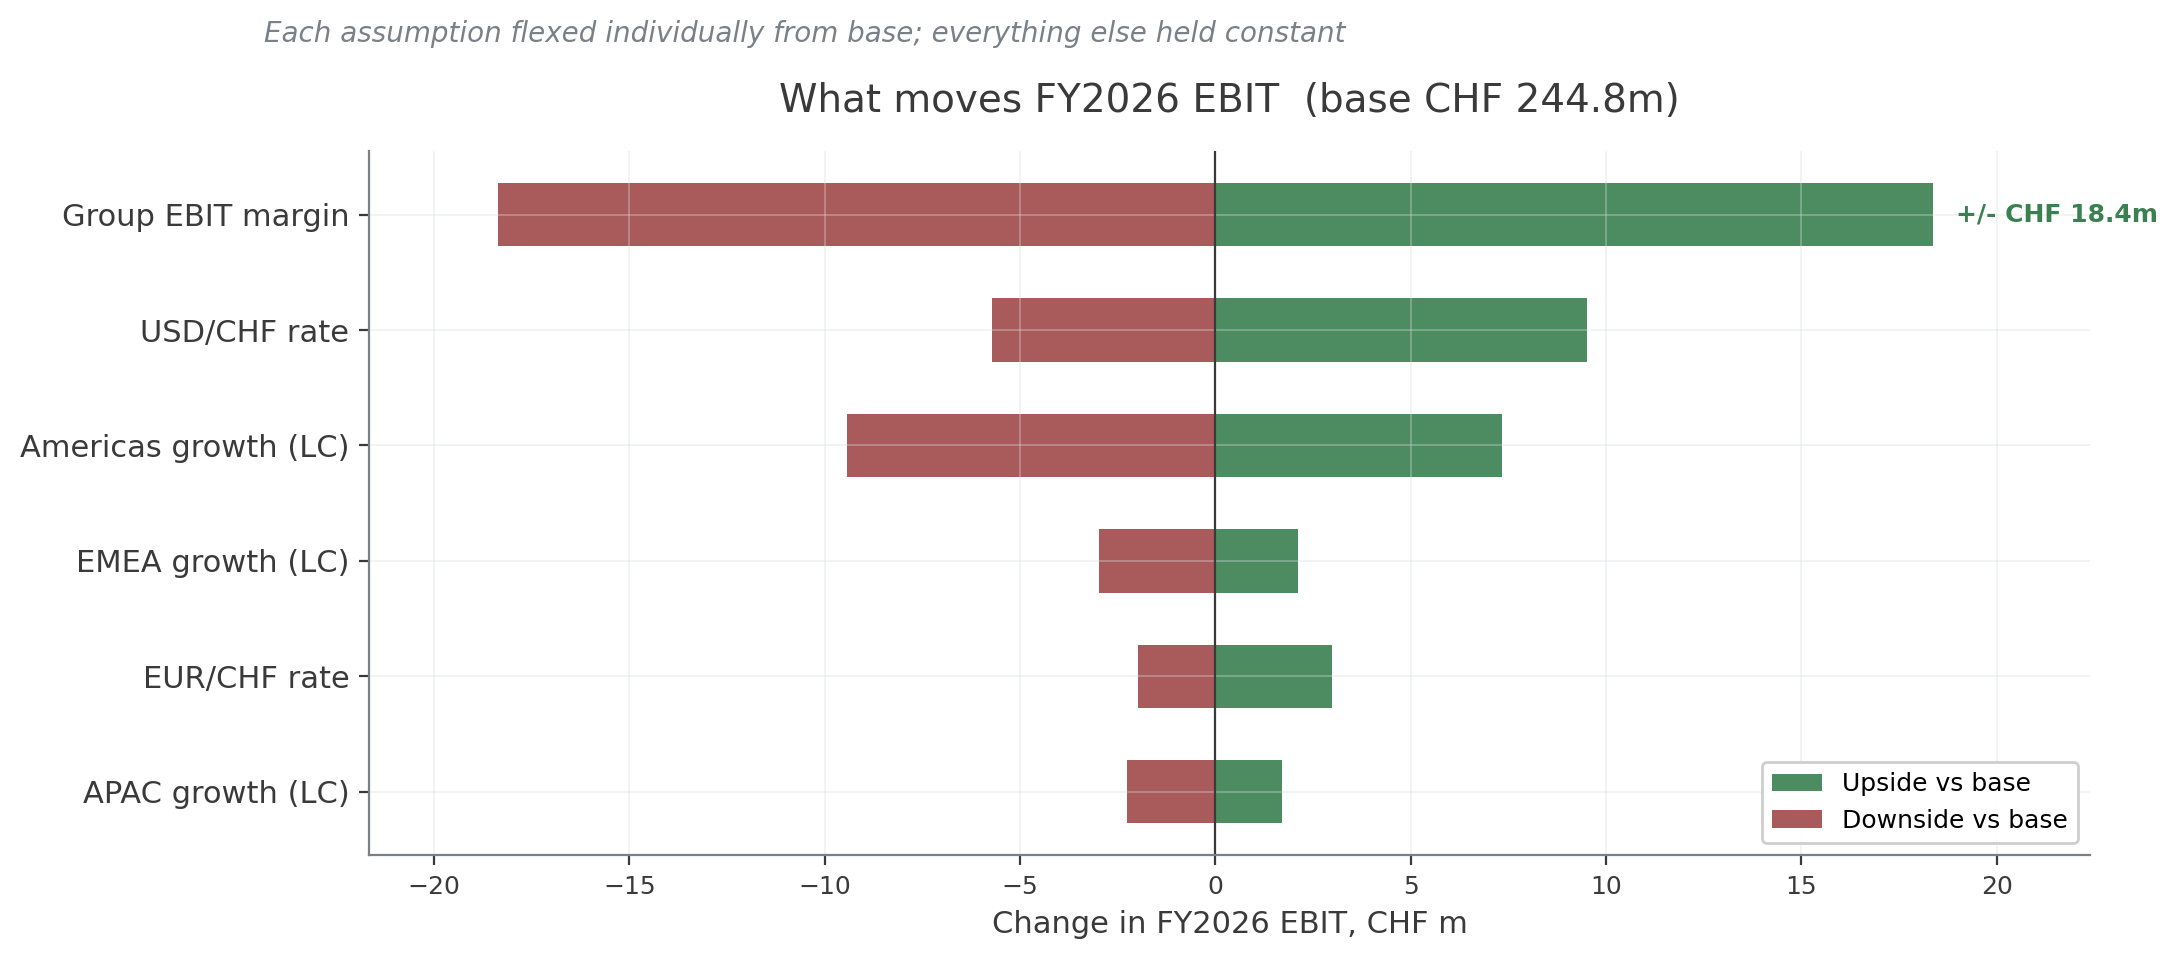
Group EBIT margin is the dominant lever (±CHF 18.4m). USD/CHF and Americas growth follow (combined effect about CHF 17m because Americas is now 49% of revenue and USD-translated). EMEA and APAC drivers are second-order at this scale of business.
For free cash flow the picture is different: NWC as a percent of revenue moves FCF by ±CHF 37m, twice the EBIT margin’s effect on EBIT. Working-capital discipline matters more than margin discipline for the cash story, and the model surfaces that without me having to engineer it.
Cash discipline through scenarios
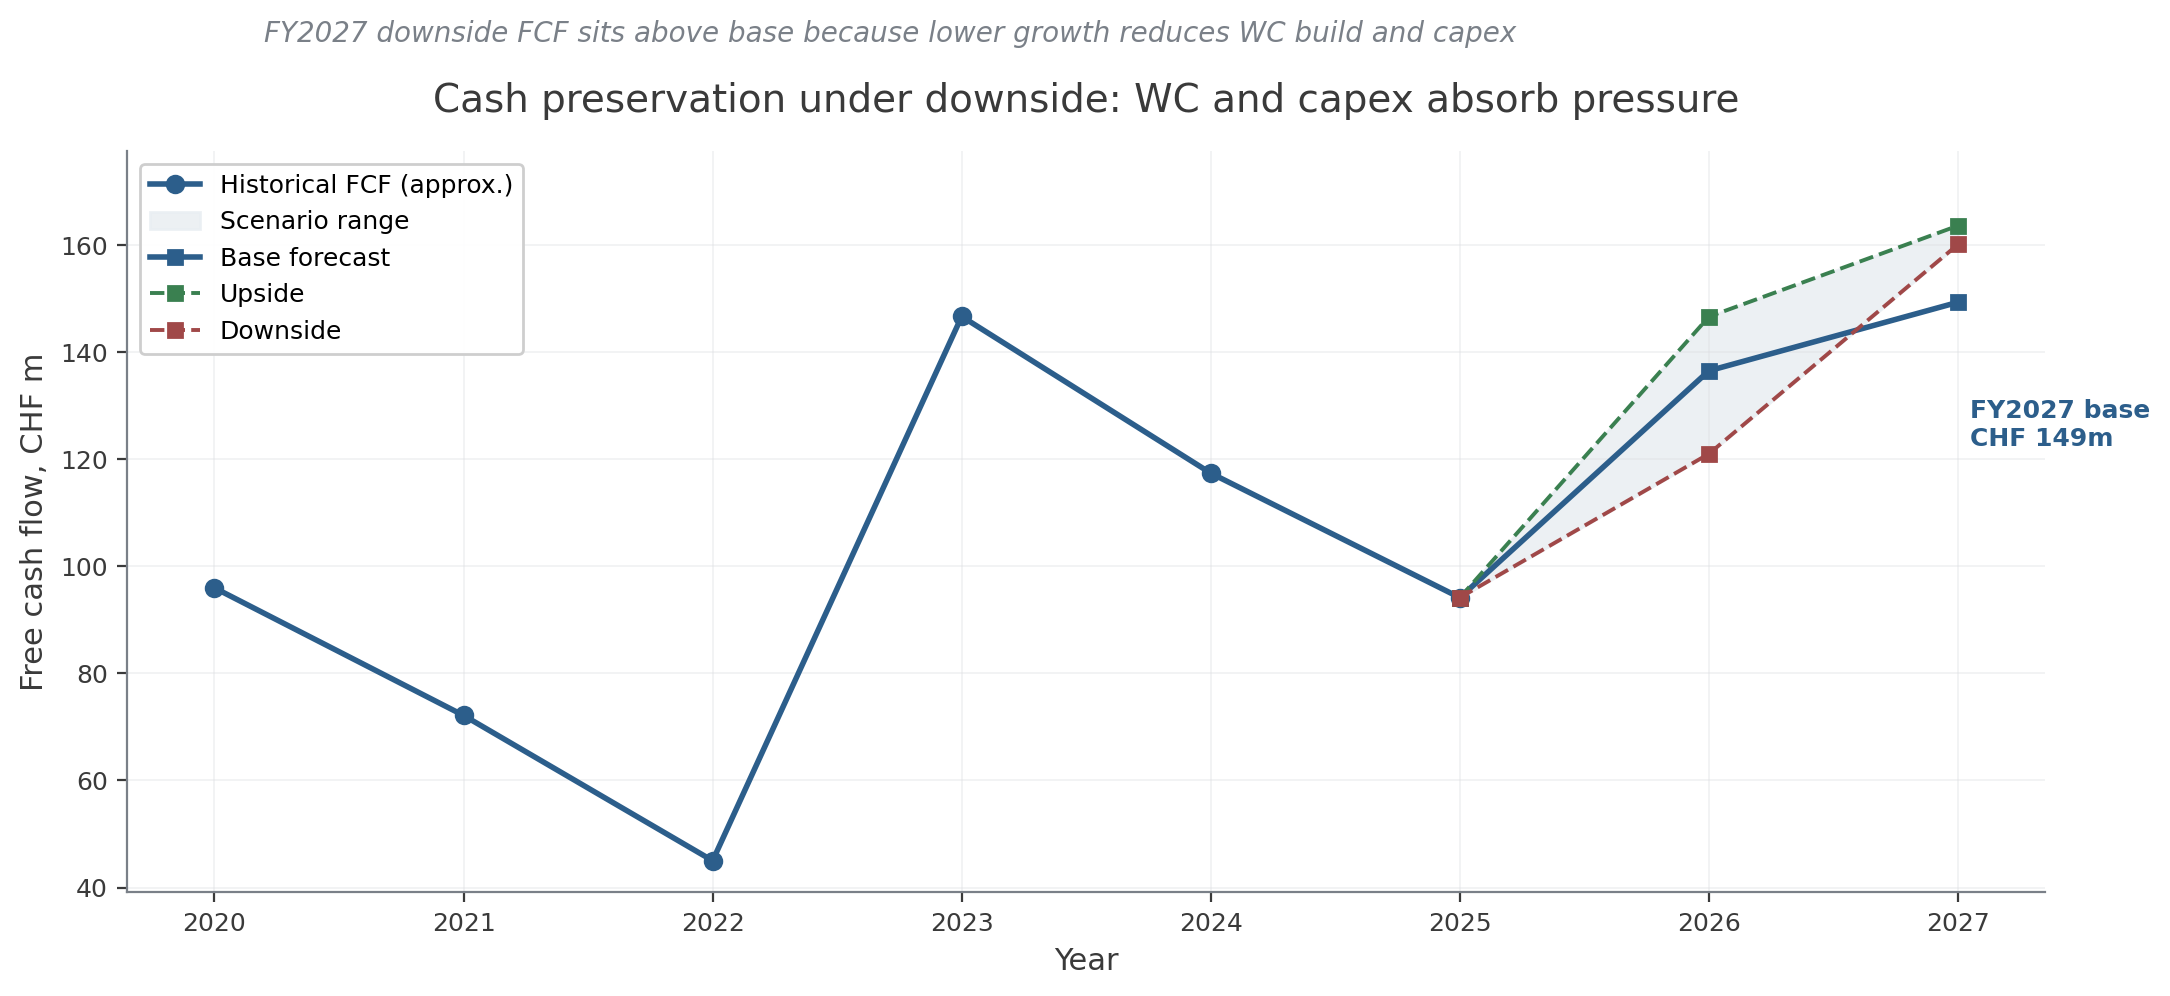
The cash chart shows a non-obvious dynamic: FY2027 downside FCF (CHF 160m) sits above FY2027 base (CHF 149m). It is not operating outperformance. Lower revenue means a smaller working-capital build (less cash absorbed) and lower capex (less cash deployed). The two effects more than offset weaker net income. This is exactly the kind of finding a controller wants to put in front of a CFO when discussing what the downside actually looks like in cash terms.
Headline numbers
| Line | FY2025 actual | FY2026 base | FY2027 base |
|---|---|---|---|
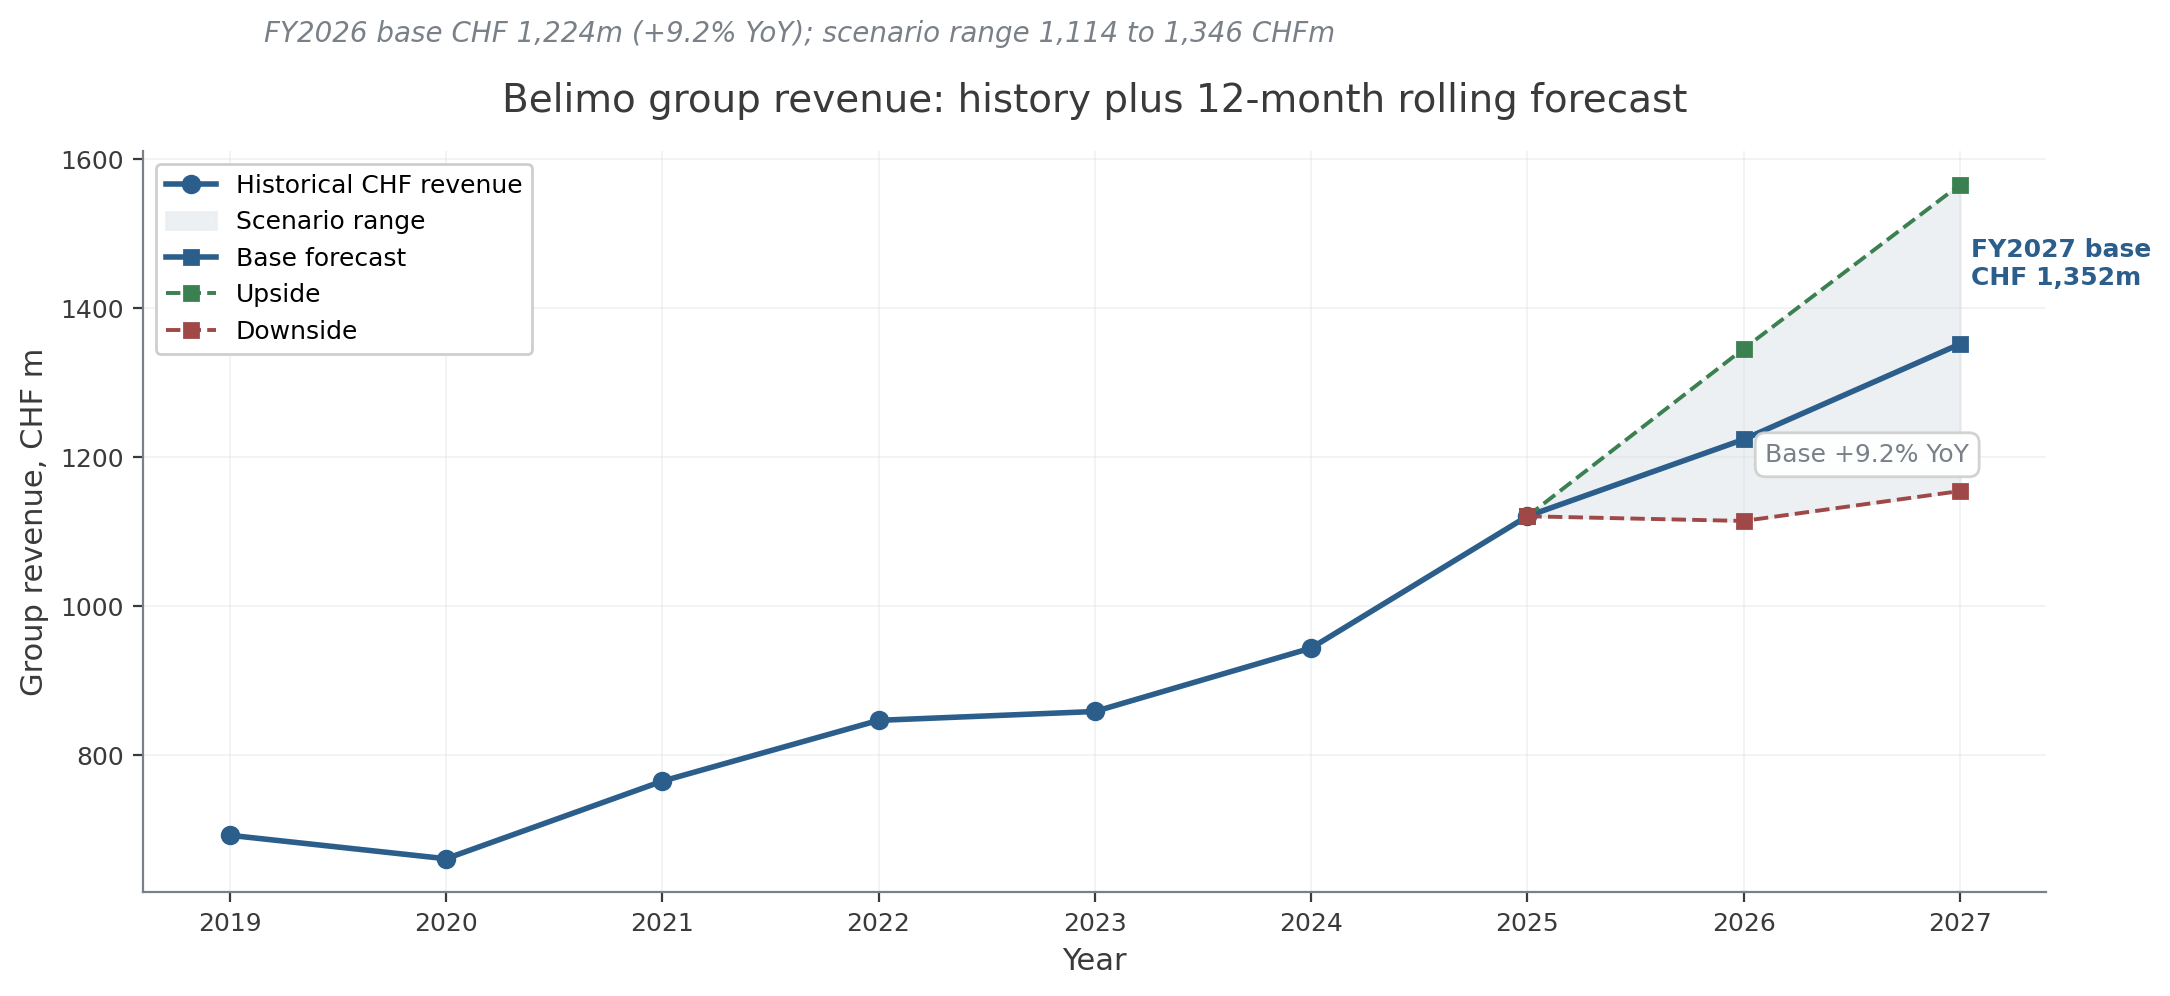
| Revenue | CHF 1’121m | CHF 1’224m | CHF 1’352m |
| EBIT margin | 20.8% | 20.0% | 19.5% |
| EBIT | CHF 233m | CHF 245m | CHF 264m |
| Net income | CHF 182m | CHF 196m | CHF 211m |
| Free cash flow | CHF 94m | CHF 137m | CHF 149m |
Scenario range, FY2027
| Line | Downside | Base | Upside |
|---|---|---|---|
| Revenue | CHF 1’155m | CHF 1’352m | CHF 1’566m |
| Net income | CHF 161m | CHF 211m | CHF 274m |
| Free cash flow | CHF 160m | CHF 149m | CHF 164m |
Technical artifacts
- Excel workbook: nine sheets generated from the YAML and the model: README, Assumption_Log, Macro_Inputs, Revenue_by_Region, PnL_Consolidated, Working_Capital, Cash_Flow, Scenarios, Charts. Live SUM formulas where they help; native Excel charts on the Charts sheet. Sample workbook download.
- Jupyter notebook: the orchestration layer. Cells for setup, data load, EMEA / Americas / APAC drivers, P&L assembly, working capital and cash flow, scenarios, sensitivity tornado, Excel build.
- Python module:
src/forecast.pywith the model logic;src/excel_writer.pyfor the workbook;src/case_study_charts.pyfor the public PNGs;src/render.pyto render the YAML into the markdown view. - Public data layer: Belimo annual reports FY2019 to FY2025; SNB cubes (
devkua,devkum,snboffzisa,zimoma); KOF Datenservice (kofbarometer,ds_kof_baublatt_ausblick_qtr); Eurostatsts_copr_a; FREDA33HNOandPNRESCONS; SECO Konjunkturprognose Q1 2026; FSO CPI press releases. Every source has an entry in the workbook README and a row insources.md.
How to read the numbers
The numbers are a public-data model based on Belimo reporting and macro sources. They show how the forecast reacts when growth, FX, margin, working capital, and capex assumptions move. The useful part is the control logic. Every figure has an anchor, every assumption has a source, and the materiality threshold is explicit.
The provisional points are visible in the model. APAC FX uses USD/CHF as a proxy because the country mix is not disclosed. The FY2025 KOF construction series is incomplete because Q4 is not yet published, so the regression sample stops at FY2024.
Next iteration
Two extensions would make the model harder to argue with:
- A US construction PMI series alongside the FRED HVAC orders signal, so the Americas driver has a second macro anchor on the demand side.
- A genuine APAC country-mix decomposition (China, Singapore, Korea, India weights) so the FX proxy can be replaced with a trade-weighted basket.
For now, the model stays inside what public data can support and keeps the weak spots visible. Those two additions would make the next version stronger, especially for APAC FX precision and the Americas demand signal.