Why I built it
During the month-end close, the pressure is usually about accuracy and coordination at the same time. The roles are often clear, but the handoffs are fragile: inputs depend on other departments, files arrive late or in uneven formats, rework appears near the deadline, and management still needs a clear story.
I had seen how close routines stay manual when ERP postings, bank movements, and working files sit in different places. Excel often becomes the coordination layer, while explanations move through email, Teams, and last-minute comments before reporting deadlines.
That creates a difficult loop: the work needs more structure, but the people who could improve it are busy keeping the close moving. A better setup should reduce rework, make evidence easier to trust, and keep more time for analysis, challenge, and decision support. The practical move is to connect the surrounding signals, not replace every finance tool at once.
That is the idea behind this cockpit. For Musterwerke Schweiz AG, a fictional Swiss KMU, I focused on the few signals that make the March close easier to run: debtor risk, working-capital movement, cost-centre variance, source traceability, owner follow-up, and a briefing view for the final management note.
Market signal
The market evidence points to the same pressure. PwC Switzerland’s 2024 finance and accounting digitalisation study reported that only 15% of Swiss organisations had completed digital transformation in finance and accounting, while 90% saw efficiency gains in controlling and management accounting.
Recent management-accounting research points in the same direction: finance-function digitalisation is tied to automation and analytics, while dashboard adoption depends on information quality, decision quality, and organisational support. That reinforced the design choice: each KPI should explain whether the number can be trusted and what action it asks for.
What the dashboard includes
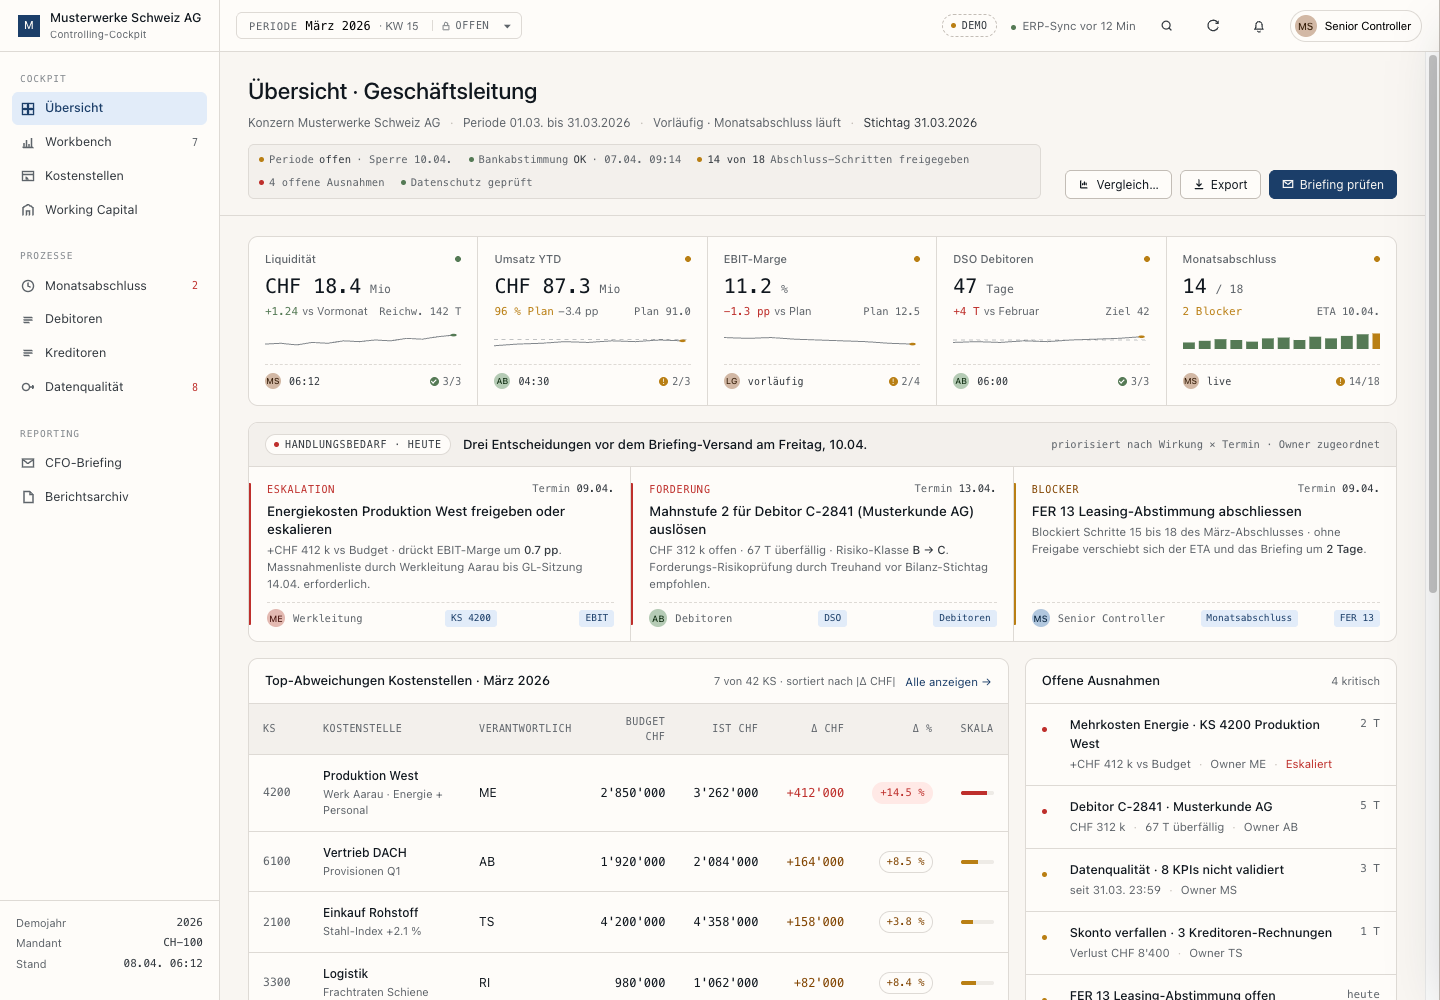
The overview screen brings the March close into one place. It shows liquidity, revenue against plan, EBIT margin, DSO, close progress, three priority actions, top cost-centre variances, working-capital movement, and a briefing preview.
I treated the page as a controller workbench. The main table is Budget/Ist by cost centre. The right side keeps exceptions visible. The action strip turns variance into follow-up: decision needed, debtor risk, close blocker.
The UI is German-first because the cockpit is aimed at Swiss controlling work.
The drawer is the proof point
The drawer is where the cockpit has to prove itself. A controller needs more than the over-budget flag for KS 4200: the formula, the source rows, the refresh time, the validation checks, and the responsible owner.
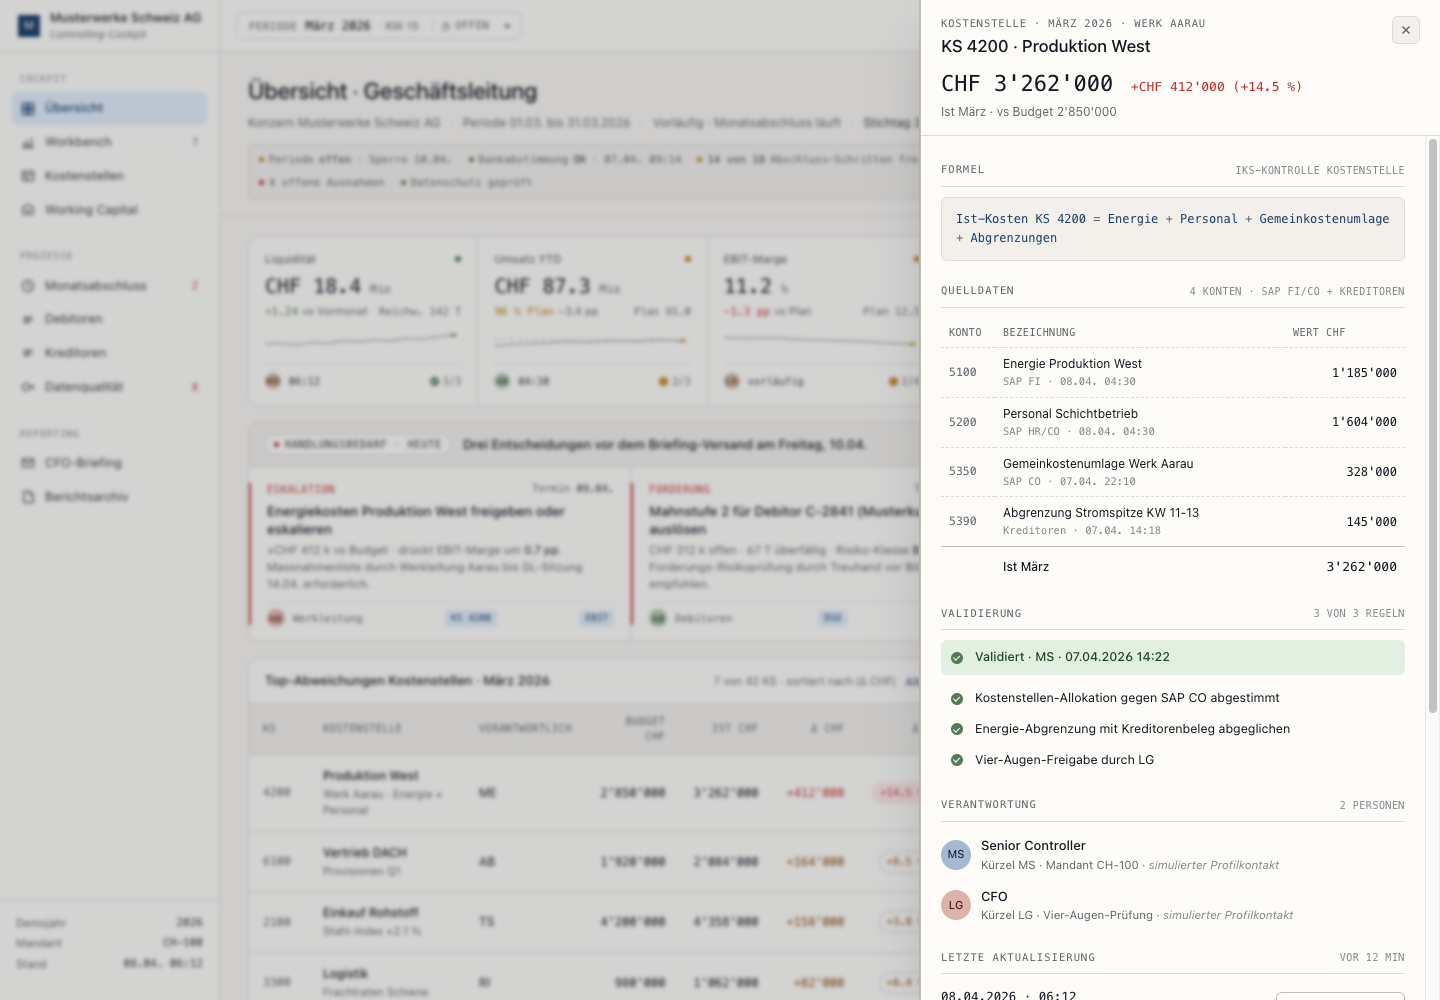
That is where the page starts to feel like a controlling tool instead of a reporting mockup. The drawer explains why the number exists through energy, personnel, allocation, and accrual rows. It also shows which checks passed and which approval path is still attached to the variance.
From cockpit to stakeholder briefing
The second workflow turns the reviewed numbers into a standardized stakeholder briefing. The controller should not have to rewrite the whole month-end story after checking the figures. The briefing view turns the main variance, debtor risk, close blocker, and data status into a concise report for the CFO, head of finance, CEO, or Geschäftsleitung.
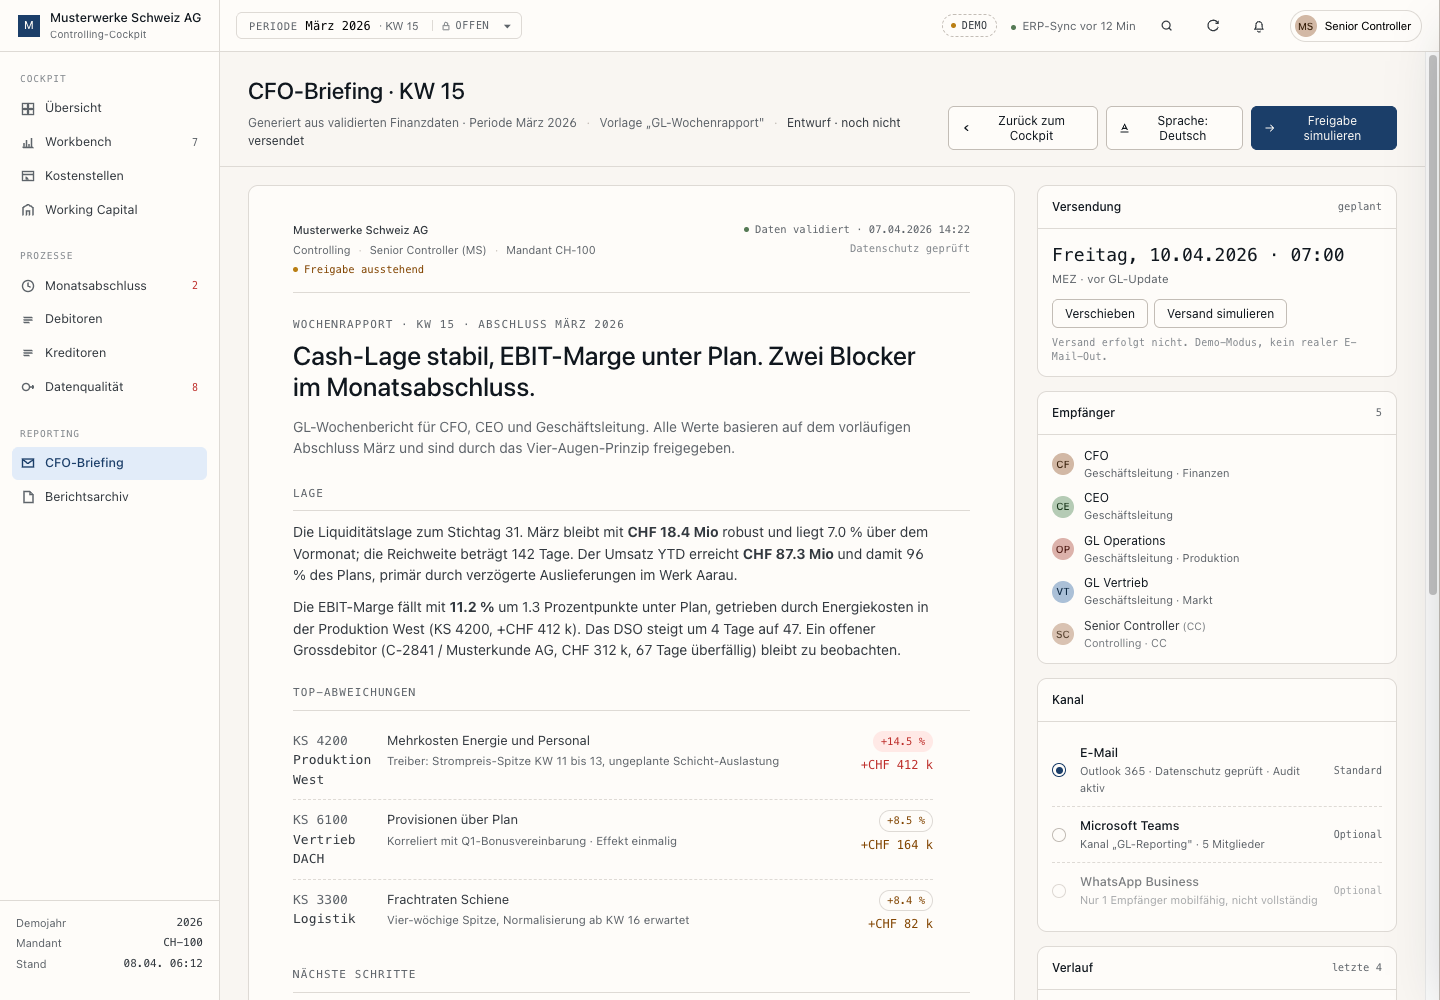
That output could support email, Microsoft Teams, encrypted WhatsApp Business messages, or reminders for overdue items, depending on company policy.
Operating choices
I kept the status row operational. It shows period lock, bank reconciliation, close-step approval, open exceptions, and privacy checked. It does not lead with invented internal-control codes or legal references, because those would feel more like someone decorating the interface with compliance vocabulary than someone using the tool.
The result shows finance data moving from a static report into a controllable operating conversation.
What this shows
This is the kind of finance system thinking the cockpit is meant to show: which figures belong together, when a KPI needs supporting rows, how exceptions should be assigned, and how close status becomes a leadership-ready narrative.
The Musterwerke example gives those questions a concrete setting: what is off, what blocks the close, what needs a decision, who owns the next step, and where the numbers came from.
The next step would be to connect the screens to a finance data layer. In a real setup, OLAP models, data marts, or similar orchestration layers could sit behind the cockpit, so the same figures can be analysed by period, cost centre, account, entity, customer, or owner without rebuilding the story in Excel each time.